Note
Click here to download the full example code
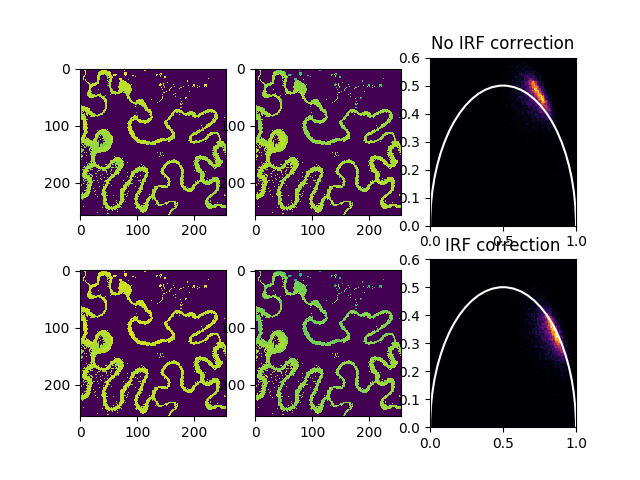
Phasor analysis of images
For phasor image analysis the library fit2x provides functions
from __future__ import print_function
import tttrlib
import fit2x
import pylab as p

data = tttrlib.TTTR('../../test/data/imaging/pq/ht3/crn_clv_img.ht3')
data_mirror = tttrlib.TTTR('../../test/data/imaging/pq/ht3/crn_clv_mirror.ht3')
data_irf = data_mirror[data_mirror.get_selection_by_channel([0, 1])]

ht3_reading_parameter = {
    "marker_frame_start": [4],
    "marker_line_start": 1,
    "marker_line_stop": 2,
    "marker_event_type": 1,
    "n_pixel_per_line": 256,
    "reading_routine": 'default',
    "channels": [0, 1],
    "fill": True,
    "tttr_data": data,
    "skip_before_first_frame_marker": True
}
image = tttrlib.CLSMImage(**ht3_reading_parameter)
frequency = 32.0  # MHz
stack_frames = True
frequency_mt = frequency / (1000. / data.header.micro_time_resolution)

# No IRF correction
phasor = fit2x.phasor.get_phasor_image(
    image=image,
    stack_frames=stack_frames,
    frequency=frequency_mt
)

n_frames = 1 if stack_frames else image.n_frames
phasor_1d = phasor.reshape((n_frames * image.n_lines * image.n_pixel, 2))
phasor_x, phasor_y = phasor[:, :, :, 0], phasor[:, :, :, 1]
phasor_x_1d, phasor_y_1d = phasor_1d.T[0], phasor_1d.T[1]

fig, ax = p.subplots(nrows=2, ncols=3)
ax[0,2].set(xlim=(0, 1), ylim=(0, 0.6))
a_circle = p.Circle(
    xy=(0.5, 0),
    radius=0.5,
    linewidth=1.5,
    fill=False,
    color='w'
)
ax[0, 2].add_artist(a_circle)
ax[0, 2].hist2d(
    x=phasor_x_1d,
    y=phasor_y_1d,
    bins=101,
    range=((0, 1), (0, 0.6)),
    cmap='inferno'
)
ax[0,0].imshow(phasor_x[0,:,:])
ax[0,1].imshow(phasor_y[0,:,:])

# IRF correction
data_irf = data_mirror[data_mirror.get_selection_by_channel([0, 1])]
phasor = fit2x.phasor.get_phasor_image(
    image=image,
    tttr_irf=data_irf,
    stack_frames=stack_frames,
    frequency=frequency_mt,
    minimum_number_of_photons=30
)
n_frames = 1 if stack_frames else image.n_frames
phasor_1d = phasor.reshape((n_frames * image.n_lines * image.n_pixel, 2))
phasor_x, phasor_y = phasor[:, :, :, 0], phasor[:, :, :, 1]
phasor_x_1d, phasor_y_1d = phasor_1d.T[0], phasor_1d.T[1]

ax[0, 2].set_title('No IRF correction')
ax[1, 2].set_title('IRF correction')
ax[1, 2].set(xlim=(0, 1), ylim=(0, 0.6))
a_circle = p.Circle(
    xy=(0.5, 0),
    radius=0.5,
    linewidth=1.5,
    fill=False,
    color='w'
)
ax[1,2].add_artist(a_circle)
ax[1,2].hist2d(
    x=phasor_x_1d,
    y=phasor_y_1d,
    bins=101,
    range=((0, 1), (0, 0.6)),
    cmap='inferno'
)
ax[1,0].imshow(phasor_x[0,:,:])
ax[1,1].imshow(phasor_y[0,:,:])

p.show()
Total running time of the script: ( 0 minutes 6.636 seconds)